 Jovian Labs
Fiber diameter analysis from SEM images
For electrospun nanofiber mats, filter media, nonwovens and scaffolds: upload SEM images and get the length-weighted diameter distribution with its 95% confidence interval, D10/D50/D90, beads, fiber alignment, eight quality checks and a PDF report. No more drawing 100 lines by hand.
Run it on Apify Example report (PDF)
Measured like a line width, not guessed from a threshold
Most automatic tools measure fibers on a black-and-white mask, so the result moves with the threshold. Here the fiber axis is traced, and at each point the width is read on the grey-level profile across the fiber, at half maximum, to a fraction of a pixel. On isolated fibers 8 to 40 pixels wide it reads within 0.6 pixel of the truth.
Accuracy on synthetic nanofiber mats
| Case | True mean | Measured | 95% CI |
|---|---|---|---|
| Demo, 28 fibers per image | 295 nm | 292 nm | 284–300 nm |
| Dense mat, 38 fibers per image | 299 nm | 295 nm | 287–304 nm |
| Thin fibers, about 7 px across | 148 nm | 153 nm | 150–156 nm |
| Aligned mat | 305 nm | 302 nm | 293–311 nm |
Limit: in very dense mats of thick fibers, fibers partly hidden by others read too thin, and the run flags a large share of excluded axis.
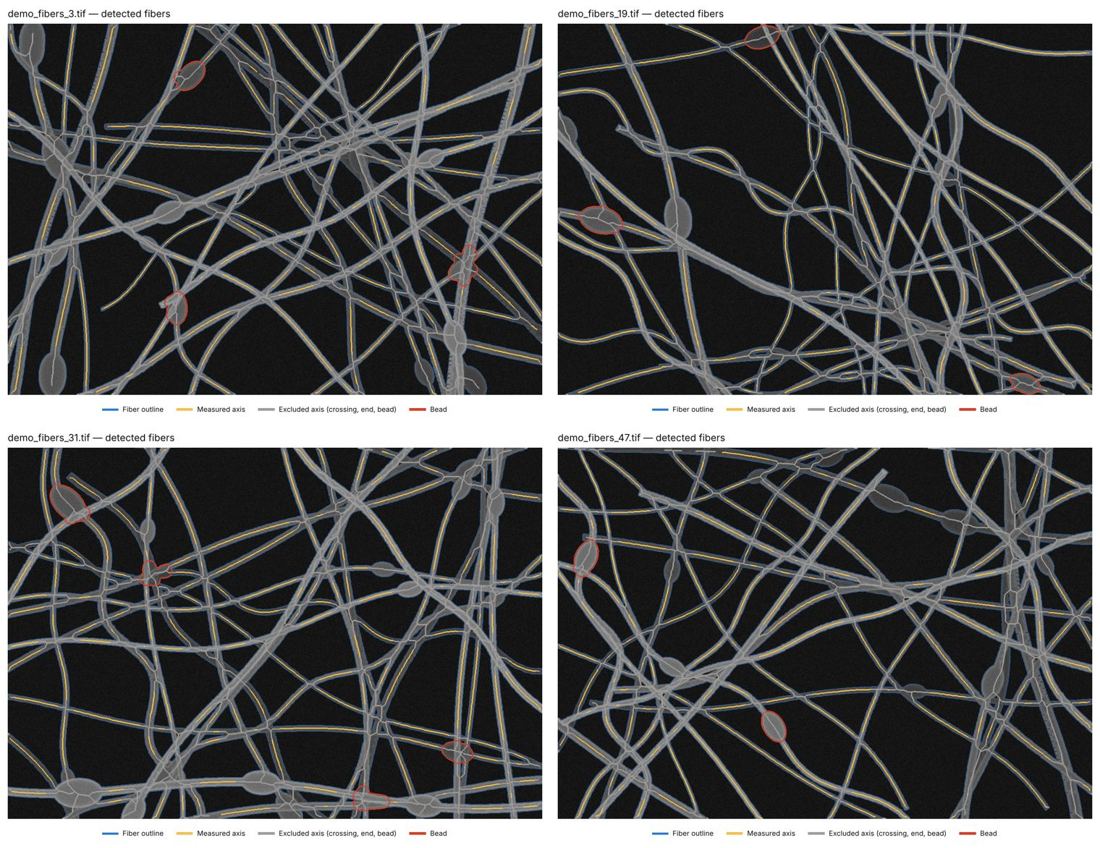
Control sheet from the demo
Questions
Which images can I use?
SEM images of one sample at the same magnification, with at least 8 pixels across a typical fiber, as TIFF, PNG or JPG. Original Zeiss or Thermo Fisher TIFF files are calibrated from their metadata; otherwise give the scale bar length or the pixel size.
How is the diameter measured?
At each point of the fiber axis, on the intensity profile perpendicular to the fiber: the full width at half maximum between the local background and the peak, with sub-pixel interpolation, as a CD-SEM measures a line width. Crossings, fiber ends and beads are excluded.
Are beads counted?
Yes, with a prudent rule: the count is a lower bound, because beads on a crossing or under other fibers are not counted.
How does it compare with DiameterJ or manual ImageJ measurements?
It uses the same idea as DiameterJ (fiber axis and local width) but measures the width on the grey-level profile instead of a binary mask, weights by length, and gives a confidence interval from a bootstrap over fiber segments. No installation is needed.
What does it cost?
1 US dollar per image analysed, billed by Apify. Demo runs on synthetic images are free.